
Have you ever wished your app could manage unexpected traffic increases without breaking a sweat (or your budget)? One of the potential winning Kubernetes capabilities that can help is the Kubernetes Horizontal Pod Autoscaler (HPA). Kubernetes HPA is designed to dynamically adjust the number of pods in your deployment based on utilization.
It’s sort of like having a smart assistant who monitors your application workload and adds or removes resources as necessary. Now, let’s look at how HPA works and how you can use it to keep your apps running smoothly.
Understanding HPA – Why It Matters
Kubernetes HPA can automatically adjust the number of pods in your deployment based on their usage metrics. Think of it as a threshold driven thermostat for your app – when things heat up, it adds more cooling power by adding more available scale-out resources. When things cool down, it scales back to save energy.
How HPA Works
HPA keeps a constant eye on your app’s vital signs. Here’s what it does:
- Monitor Metrics: HPA gathers metrics (CPU, memory, custom) from the Kubernetes cluster
- Calculate Desired Replicas: Based on metrics and your configuration (target utilization, minimum and maximum replicas), HPA determines the optimal number of pods.
- Update Deployment: HPA instructs Kubernetes to add or remove pods to match the desired replica count.
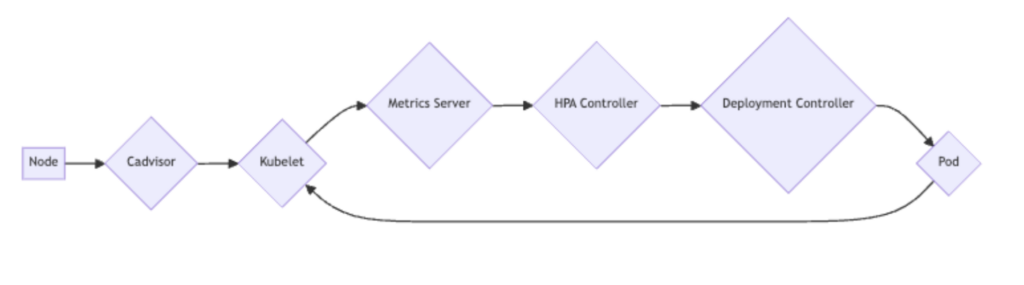
To do the first step of gathering and monitoring metrics, HPA relies on another key component – the metric server.
Understanding the Metrics Server
The Metrics Server is a key part of Kubernetes. It gathers data on how your system is working, like how much CPU and memory your apps use. This data is important for tools like Horizontal Pod Autoscaler (HPA) to make smart decisions.
The Metrics Server collects data from your cluster’s nodes. It adds up the numbers and shares the results with other tools. These tools use this information to make changes, like adding or removing copies of your apps.
While the Metrics Server is helpful, it’s not perfect. It’s important to make sure the data is correct. Also, it needs to be fast to keep up with your system. And, like everything, it needs to be secure.
HPA Scaling Strategies
HPA isn’t just about CPU. You can also configure it to scale based on custom metrics like:
- Memory usage,
- Number of requests
- Any other metric relevant to your application’s performance.
By utilizing different HPA scaling strategies, you can fine-tune the scaling behavior of your application to better meet its specific needs.
Scale Based on Memory
You can set up HPA to watch memory use too:
apiVersion: autoscaling/v2
kind: HorizontalPodAutoscaler
metadata:
  name: memory-demo-hpa
spec:
  scaleTargetRef:
    apiVersion: apps/v1
    kind: Deployment
    name: memory-demo
  minReplicas: 1
  maxReplicas: 10
  metrics:
  - type: Resource
    resource:
      name: memory
      target:
        type: Utilization
        averageUtilization: 50
Use Custom Metrics
apiVersion: autoscaling/v2
kind: HorizontalPodAutoscaler
metadata:
  name: custom-metric-hpa
spec:
  scaleTargetRef:
    apiVersion: apps/v1
    kind: Deployment
    name: custom-metric-app
  minReplicas: 1
  maxReplicas: 10
  metrics:
  - type: Pods
    pods:
      metric:
        name: packets-per-second
        target:
          type: AverageValue
          averageValue: 1k
Have you got a specific metric that matters to your app? You can use that too:
This example scales based on network traffic, which shows the different dimensions you can use for triggering scaling actions.
Tips for Successful Kubernetes HPA Implementation
To get the most out of HPA, you should:
- Set accurate resource requests: HPA uses these as a baseline, so make them count.
- Use readiness probes: This keeps traffic from hitting pods that aren’t ready yet.
- Team up with Cluster Autoscaler: This combo scales both pods and nodes for full coverage.
- Keep an eye on things: Regularly check your HPA settings and tweak as needed.
- Don’t scale too fast: Set cooldown periods to avoid rapid pod count changes.
HPA is a handy tool in the Kubernetes toolkit, but also comes with some caveats.
Common Challenges with HPA and How to Overcome Them
HPA solves some problems but can still cause operational issues. For example, when the resource requests are set too low, it can cause the HPA to scale up pods unnecessarily and potentially lead to resource exhaustion. Failure to set proper readiness probes can lead to higher latency and errors as traffic is directed to pods that are not fully prepared to handle it. There are a multitude of factors that can lead to HPA troubles.
A few key things to watch out for:
- Missing metrics: Make sure your cluster can actually provide the metrics HPA needs.
- Stateful apps: These can be tricky to scale. Plan carefully with your application teams to ensure you are designing to manage scaling both your stateful and stateless apps.
- Scaling delays: New pods take time to spin up. Factor this into your plans.
- Cost of scaling actions: Make sure you understand the cost and thresholds when scaling up and down. You may be surprised by an unexpected bill shock. There are many factors that affect costs in cloud-based Kubernetes deployments.
Troubleshooting Kubernetes HPA
If you’re experiencing issues with HPA, start by checking your metrics to ensure they are being properly collected. Next, review your application’s architecture to see if there are any stateful components that may be causing scaling difficulties.
Additionally, be patient with scaling delays and consider adjusting your cooldown periods to allow for smoother transitions. By carefully monitoring and adjusting your HPA settings, you can optimize your cluster’s performance and ensure efficient scaling for your applications.
If HPA is not functioning as expected, you can take the following steps to troubleshoot:
- Check HPA status: Use kubectl describe hpa <hpa-name> to see what’s going on.
- Verify metrics: Make sure your metrics server is running and collecting data.
- Look at pod logs: Your app pods might be telling you what’s wrong.
Check cluster events: Use kubectl get events to see if there are cluster-wide issues.
Setting Up HPA on Amazon EKS: A Step-by-Step Guide
Prerequisites
- An existing Amazon EKS cluster.
- Basic understanding of Kubernetes and YAML.
- kubectl configured to interact with your EKS cluster.
Steps
- Create an EKS Cluster: If you don’t have an EKS cluster, create one using the AWS Management Console, AWS CLI, or infrastructure as code tools like Terraform.
- Install the Metrics Server: The Metrics Server collects resource utilization data. Deploy it using the provided YAML manifest:
kubectl apply -f https://github.com/kubernetes-sigs/metrics-server/releases/download/v0.5.2/components.yamlTo make sure the data is always available, the Metrics Server usually runs as a single copy. You can set it up to run on every node by running the Metrics Server as a DaemonSet if you need to, though it is not recommended due to potential performance and scalability issues.
apiVersion: apps/v1
kind: DaemonSet
metadata:
  name: metrics-server
spec:
  selector:
    matchLabels:
      app: metrics-server
  template:
    metadata:
      labels:
        app: metrics-server
    spec:
      containers:
      - name: metrics-server
        image: k8s.gcr.io/metrics-server:v0.5.2 # Replace with the desired image version
        command:
        - /metrics-server
        - --kubelet-preferred-address-types=InternalIP,ExternalIP,Hostname
        - --kubelet-use-node-status-addresses=true
        securityContext:
privileged: true # Required for collecting node metrics- Deploy Your Application: Create a deployment for your application. This example uses a Node.js app:
apiVersion: apps/v1
kind: Deployment
metadata:
  name: nodejs-app
spec:
  replicas: 2
  selector:
    matchLabels:
      app: nodejs-app
  template:
    metadata:
      labels:
        app: nodejs-app
    spec:
      containers:
      - name: nodejs-app
        image: your-nodejs-image:latest
        ports:
        - containerPort: 3000
        resources:
          requests:
            cpu: "100m"
          limits:
cpu: "200m"- Create a Service: Expose your application with a Service:
apiVersion: v1
kind: Service
metadata:
  name: nodejs-app-svc
spec:
  selector:
    app: nodejs-app
  ports:
  - protocol: TCP
    port: 80
targetPort: 3000- Create the HPA: Define the scaling behavior using an HPA resource:
apiVersion: autoscaling/v2beta2
kind: HorizontalPodAutoscaler
metadata:
  name: nodejs-app-hpa
spec:
  scaleTargetRef:
    apiVersion: apps/v1
    kind: Deployment
    name: nodejs-app
  minReplicas: 1
  maxReplicas: 5
  metrics:
  - type: Resource
    resource:
      name: cpu
      target:
        type: Utilization
        averageUtilization: 70
Verify HPA Functioning: Monitor HPA behavior using:
kubectl get hpa nodejs-app-hpa -watchTo see HPA do its thing, let’s create some traffic:
kubectl run -i --tty load-generator --rm --image=busybox --resta=Never -- /bin/sh -c "while sleep 0.01; do wget -q -O- http://<your url>; done"Now, keep an eye on HPA:
kubectl get hpa nodejs-app-hpa -watchYou’ll see the number of pods increase as CPU use goes up. Keep an eye on this output to ensure that your application is scaling appropriately and efficiently based on the defined metrics.
Additionally, you can also use the kubectl describe hpa command to get more detailed information about the HPA resource and its current status. By closely monitoring the HPA, you can keep track of performance and resource utilization to track efficiency.
Additional Considerations
- Use custom metrics for more precise scaling.
- Implement proper error handling and logging.
- Consider Spot instances for cost reduction.
- Regularly monitor HPA performance and adjust parameters as needed.
By following these steps and considering additional factors, you can effectively leverage HPA to optimize resource utilization and application performance on your EKS cluster.
Key Takeaways: Mastering HPA for Better Kubernetes Performance
Kubernetes HPA is a helpful tool for keeping your apps running smoothly under varying loads. It automatically adjusts resources based on real-time needs, helping you maintain performance without wasting resources.
While HPA has its quirks, understanding how it works and following best practices will help you use it effectively. Keep in mind, HPA is a key component of the Kubernetes ecosystem. Integration with other Kubernetes features is essential for developing robust and efficient applications.
By making effective use of HPA, you’re on your way to creating more responsive and cost-effective Kubernetes setups. Continue experimenting and learning – that’s the key to maximizing Kubernetes for your unique requirements.
Also from the EMP blog:
Karpenter vs Cluster Autoscaler vs EMP – Compare the different cluster autoscalers with EMP for EKS cost optimization